39%reduction
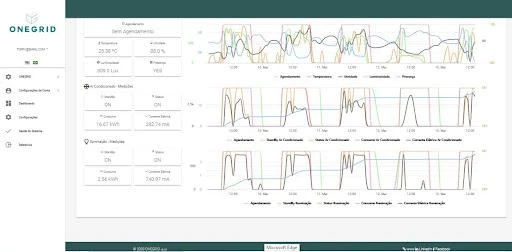
The dashboard shows how each environment behaves through the day — when it switches on, how much it draws and how long it stays active.
In retail, with many units on similar schedules, that comparative view exposes the outlier store straight away.